Installing
ELK (ElasticSearch, Logstash & Kibana)
1.
Introduction
In this document,
we will go over the installation of the Elasticsearch ELK Stack on Redhat 7
which includes, Elasticsearch 2.2.x, Logstash 2.2.x, and Kibana 4.4.x. Later
we’ll be configuring it to gather and visualize the syslogs of your systems in
a centralized location, using rsyslog.
Logstash is an
open source tool for collecting, parsing, and storing logs for future use.
Kibana is a web interface that can be used to search and view the logs that
Logstash has indexed. Both of these tools are based on Elasticsearch, which is
used for storing logs.
Centralized
logging can be very useful when attempting to identify problems with your
servers or applications, as it allows you to search through all of your logs in
a single place. It is also useful because it allows you to identify issues that
span multiple servers by correlating their logs during a specific time frame.
1.1 Our
Goal
The goal of this guide is to set up
Logstash to gather syslogs of multiple servers, and set up Kibana to visualize
the gathered logs.
Our ELK stack setup has four main
components:
Logstash: The server component of Logstash that processes incoming logs
Elasticsearch: Stores all of the logs
Kibana:
Web interface for searching and visualizing logs
rSyslog:
Configured on client servers that will send logs to rsyslog configured on ELK
Stack using UDP protocol.
We will install the first three components
on a single server, which we will refer to as our ELK Server.
Configure rsyslog to export rsyslog logs to logstash by defining file in rsyslog.d directory and place JSON template file in same directory. Sample configuration of exporting rsyslog logs
50-Output.conf
*.* @logstash_server_ip:5601; json_template_name;
2. Prerequisites
To proceed
further, you will require root access to Redhat 7 VPS.
The amount of CPU, RAM, and storage that
ELK Server will require depends on the volume of logs that you intend to
gather. Below are the min specs for setting up ELK Server:
OS: Redhat 7
RAM: 4GB
CPU: 2
In addition to your ELK Server, you will
want to have a few other servers that you will gather logs from.
Let's get started on setting up our ELK
Server!
3. Install Java 8
Elasticsearch and
Logstash require Java, so we will install that now. We will install a latest
version of Oracle Java 8 as Elasticsearch recommends.
Change to your home directory and download
the Oracle Java JDK RPM with these commands:
$ java –version
[root@server]# cd ~
[root@server]# wget --no-cookies
--no-check-certificate --header "Cookie:
gpw_e24=http%3A%2F%2Fwww.oracle.com%2F;
oraclelicense=accept-securebackup-cookie" "https://download.oracle.com/otn-pub/java/jdk/8u102-b14/jdk-8u102-linux-x64.rpm"
Then install the
RPM with this yum command (if you downloaded a different release, substitute
the filename here):
[root@server]# yum -y localinstall jdk-8u102-linux-x64.rpm
Now Java should be installed at
/usr/java/jdk1.8.0_73/jre/bin/java, and linked from /usr/bin/java.
You may delete the archive file that you
downloaded earlier (Optional):
[root@server]# rm ~/jdk-8u102-linux-x64.rpm
4. Install Elasticsearch
Elasticsearch can
be installed with a package manager by adding Elastic's package repository.
Run the following command to import the
Elasticsearch public GPG key into rpm:
[root@server]# rpm --import https://packages.elastic.co/GPG-KEY-elasticsearch
Create a new yum
repository file for Elasticsearch. Note that this is a single command:
[root@server]# vim /etc/yum.repos.d/elasticsearch.repo
[elasticsearch-2.x]
name=Elasticsearch repository for 2.x
packages
baseurl=https://packages.elastic.co/elasticsearch/2.x/centos
gpgcheck=1
gpgkey=https://packages.elastic.co/GPG-KEY-elasticsearch
enabled=1
Install Elasticsearch
with this command:
[root@server]# yum -y install elasticsearch
Elasticsearch is
now installed. Let's edit the configuration:
[root@server]# vim
/etc/elasticsearch/elasticsearch.yml
To restrict
outside access to your Elasticsearch instance (port 9200), so outsiders can't
read your data or shutdown your Elasticsearch cluster through the HTTP API.
Find the line that specifies network.host, uncomment it, and replace its value with "localhost"
so it looks like this:
Save and exit elasticsearch.yml.
Now start Elasticsearch, enable it to start
automatically on boot up and check status:
[root@server]# systemctl daemon-reload
[root@server]# systemctl start elasticsearch
[root@server]# systemctl enable
elasticsearch
[root@server]# systemctl status
elasticsearch
Use CURL to check whether the Elasticsearch
is responding to the queries or not.
Sample Output
{
"name" : "Marvel Boy",
"cluster_name" : "elasticsearch",
"version" : {
"number" : "2.3.5",
"build_hash" :
"90f439ff60a3c0f497f91663701e64ccd01edbb4",
"build_timestamp" : "2016-07-27T10:36:52Z",
"build_snapshot" : false,
"lucene_version" : "5.5.0"
},
"tagline" : "You Know, for Search"
}
5. Install Logstash
The Logstash
package shares the same GPG Key as Elasticsearch, and we already installed that
public key, so let's create and edit a new Yum repository file for Logstash:
[root@server]# vim /etc/yum.repos.d/logstash.repo
Add the following
repository configuration:
[root@server]# vim
/etc/yum.repos.d/logstash.repo
[logstash-2.3]
name=Logstash repository for 2.3.x packages
baseurl=https://packages.elastic.co/logstash/2.3/centos
gpgcheck=1
gpgkey=https://packages.elastic.co/GPG-KEY-elasticsearch
enabled=1
Install Logstash with this command:
[root@server]# yum -y install logstash
Note: Logstash is installed but it is not configured yet.
5.1 Configure Logstash
Logstash
configuration files are in the JSON-format, and reside in /etc/logstash/conf.d. The configuration consists of three sections:
inputs, filters, and outputs.
Let's create a configuration file called logstash.conf
and set up our Logstash:
[root@server]# vim /etc/logstash/conf.d/10-syslog.conf
# This input block will listen on port 10514
for logs to come in.
# host should be an IP on the Logstash
server.
# codec => "json" indicates
that we expect the lines we're receiving to be in JSON format
# type => "rsyslog" is an
optional identifier to help identify messaging streams in the pipeline.
input {
syslog {
port => 10514
type => rsyslog
}
}
# This is an empty filter block. You can later add other filters here to
further process
# your log lines
filter {}
output {
if
[type] == "rsyslog" {
elasticsearch {
hosts=> ["localhost:9200"]
}
}
}
This specifies a
syslog input that will listen on port 10514, output basically configures
Logstash to store the data in Elasticsearch which is running at localhost:9200,
in an index.
Test your Logstash configuration with this command:
[root@server]# service logstash configtest
It should display
Configuration OK
if there are no syntax errors. Otherwise, try and read the error output to see
what's wrong with your Logstash configuration.
Start and enable Logstash to put our configuration changes into effect:
[root@server]# systemctl start logstash
[root@server]# systemctl enable logstash
Note: Give the ownership to logstash
You can troubleshoot any issues by looking
at below log.
[root@server]# cat
/var/log/logstash/logstash.log
6. Install Kibana
The Kibana
package shares the same GPG Key as Elasticsearch, and we already installed that
public key.
Import GPG Key for Kibana:
Add the following
repository configuration:
[root@server]# vim
/etc/yum.repos.d/kibana.repo
[kibana-4.5]
name=Kibana repository for 4.5.x packages
baseurl=https://packages.elastic.co/kibana/4.5/centos
gpgcheck=1
gpgkey=https://packages.elastic.co/GPG-KEY-elasticsearch
enabled=1
**Save and exit.
Install Kibana with this command:
[root@server]# yum -y install kibana
Open the Kibana configuration file for editing:
[root@server]# vim
/opt/kibana/config/kibana.yml
Now start the Kibana service, and enable it:
[root@server]# systemctl start kibana
[root@server]# systemctl enable kibana
[root@server]# systemctl status kibana
Now that our ELK
Server is ready to receive rsyslog logs, let's move onto setting up rsyslog on each client server.
Note: Kindly configure Filebeat and Topbeat on the client servers.
7.
Connect to Kibana
When you are finished setting up rsyslog and Topbeat
on all of the client servers that you want to gather logs form, let's look at
Kibana, the web interface that we installed earlier. In a web browser, IP
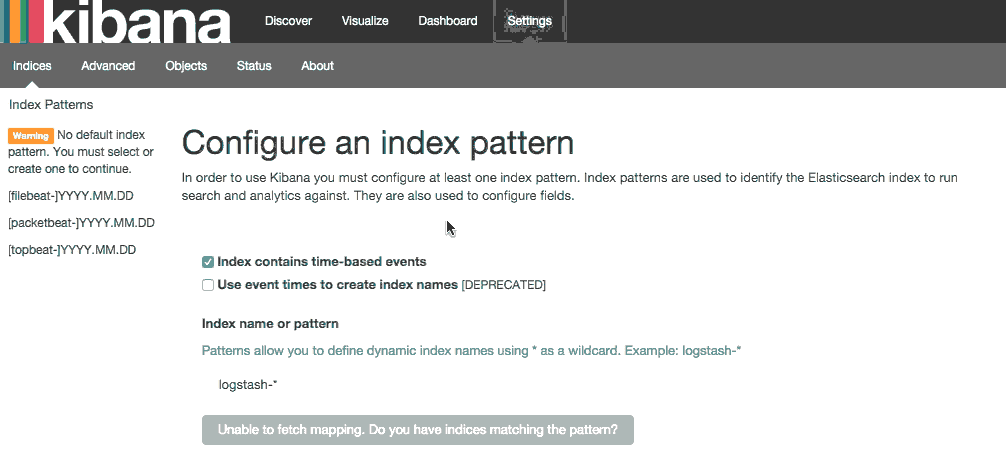
address of your ELK Server. Go ahead and select Logstash-* from the Index
Patterns menu (left side), then click the Star (Set
as default index) button to set the logstash index as the default.
Now click the
Discover link in the top navigation bar. By
default, this will show you all of the log data over the last 15 minutes. You
should see a histogram with log events, with log messages below:
Right now, there
won't be much in there because you are only gathering syslogs from your client
servers. Here, you can search and browse through your logs. You can also
customize your dashboard.
Try the following
things:
·
Search for "root" to
see if anyone is trying to log into your servers as root
· Search for a particular hostname
(search for host: "hostname")
· Change the time frame by
selecting an area on the histogram or from the menu above
· Click on messages below the
histogram to see how the data is being filtered
· Kibana has many other features,
such as graphing and filtering, so feel free to poke around!
8.
Troubleshooting Commands
[root@server]# systemctl status
logstash
[root@server]# systemctl status
elasticsearch
[root@server]# systemctl status kibana
[root@server]# systemctl restart logstash
[root@server]# systemctl restart elasticsearch
[root@server]# systemctl restart kibana
[root@server]# netstat -nlup
[root@server]# netstat –nltp
[root@server]# firewall-cmd --list-all
[root@server]# firewall-cmd --permanent
--zone=public --add-port=5044/tcp
[root@server]# java
-version
9.
Conclusion
Now that your
syslogs are centralized via Elasticsearch and Logstash, and you are able to
visualize them with Kibana, you should be off to a good start with centralizing
all of your important logs. Remember that you can send pretty much any type of
log or indexed data to Logstash.
To improve your
new ELK stack, you should look into gathering and filtering your other logs
with Logstash, and creating
Kibana dashboards.